Last updated: 31 October 2026
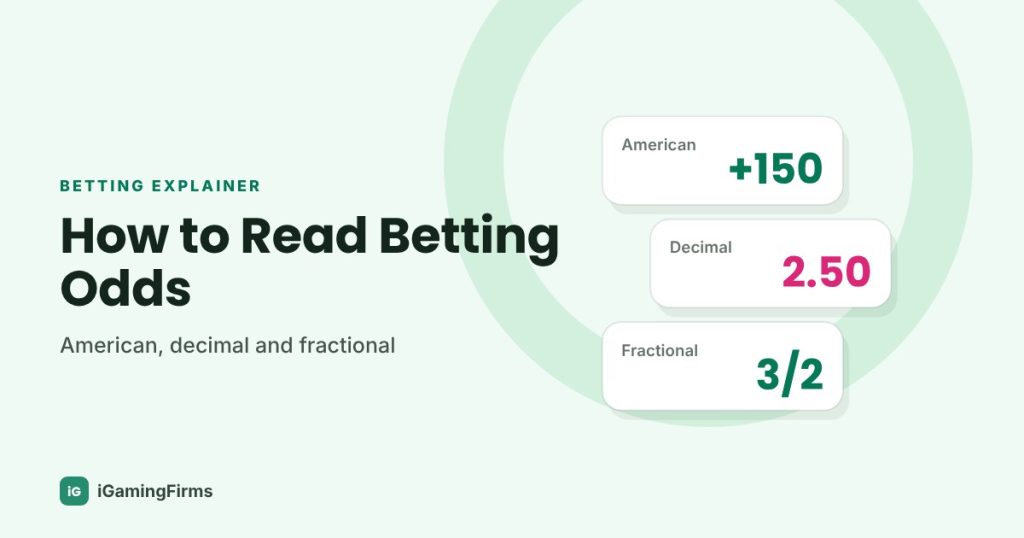
Betting odds tell you two things at once: how much a winning bet pays, and the probability the bookmaker’s price implies, with the bookmaker’s margin built in. American odds show profit on $100 (+200) or the stake needed to win $100 (-150), decimal odds show the total return per 1 unit staked (3.00), and fractional odds show profit relative to stake (2/1). All three convert to the same implied probability.
If you run a sportsbook product, write odds content for an affiliate site or build pages that rank for betting terms, you need more than the consumer version. You need the conversion formulas that do not break on negative numbers, the margin maths most explainers skip, the Asian formats your feed already carries, and the display and advertising rules that apply when you publish a price. This guide covers all of it, with every number checked.
How do betting odds work?
Every price does two jobs. It sets the payout if the selection wins, and it encodes a probability. A price of 2.00 (decimal), +100 (American) or 1/1 (fractional, called “evens”) pays a profit equal to the stake and implies a 50% chance.
The implied probability on a single price is not the bookmaker’s honest estimate of the outcome. It is the fair probability plus a share of the margin. Add up the implied probabilities of every outcome in a market and you get more than 100%. That excess is the overround, and it is how a book makes money before a single result is known. The sections below show how to read each format first, then how to take the margin back out.
American odds: what the plus and minus mean
American odds (also called moneyline odds) are anchored to $100.
- Minus sign (favourite): the number is what you must stake to win $100 profit. At -150, a $150 stake wins $100 and returns $250 in total.
- Plus sign (underdog): the number is the profit on a $100 stake. At +200, a $100 stake wins $200 and returns $300.
- +100 or -100: even money. The stake and the profit are the same.
Stakes rarely come in hundreds, so scale them. A $50 bet at -150 wins $50 x 100 / 150 = $33.33 and returns $83.33. A $20 bet at +250 wins $20 x 250 / 100 = $50 and returns $70.
Minus 120 odds mean you stake $120 to win $100, an implied probability of 54.55%. A +200 price implies 33.33%. The sign tells you which side the market favours, and the number tells you by how much.
Decimal odds: total return per unit staked
Decimal odds are the easiest to calculate with, which is why trading systems and most odds feeds store prices this way. The number is the total return, stake included, for each 1 unit staked.
- Total return = stake x decimal odds
- Profit = stake x (decimal odds – 1)
- Implied probability = 1 / decimal odds
A €25 bet at 1.85 returns €46.25, of which €21.25 is profit. Odds of 1.50 mean a 1 unit stake returns 1.50, an implied probability of 66.67%. Any price below 2.00 is odds-on (the favourite side), and any price above 2.00 is odds-against.
In some European markets the decimal point is written as a comma, so “8,5” means 8.50. That price pays far more than 2/1 (3.00): it implies 11.76% against 33.33%.
Fractional odds: profit relative to stake
Fractional odds are the traditional UK and Irish format and still dominate horse racing. The first number is the profit, the second is the stake that earns it.
- Profit = stake x (numerator / denominator)
- Decimal odds = (numerator / denominator) + 1
- Implied probability = denominator / (numerator + denominator)
A £10 bet at 7/2 wins £35 and returns £45. At 2/5 (odds-on) you stake £5 to win £2. At 8/13, a common odds-on price, the decimal equivalent is 1.615 and the implied probability is 61.9%.
Is 5/1 or 7/1 the better price? For the same selection, 7/1 pays more: £7 profit per £1 against £5. It also implies a lower probability (12.5% against 16.67%), so the bookmaker offering 7/1 rates the selection less likely to win. Horse racing odds read the same way: 9/2 equals decimal 5.50 and implies 18.18%.
Conversion formulas between the three formats
These are the formulas to put in your odds engine, calculator or content templates. Use the absolute value of negative American odds, a step at least one top-ranking explainer reviewed for this guide gets wrong.
From American odds
- Positive (+A) to decimal: 1 + A / 100. Example: +150 = 2.50.
- Negative (-A) to decimal: 1 + 100 / A. Example: -150 = 1.667.
- Positive to implied probability: 100 / (A + 100). Example: +200 = 33.33%.
- Negative to implied probability: A / (A + 100). Example: -150 = 150 / 250 = 60%.
From decimal odds
- To American, if decimal is 2.00 or higher: +(decimal – 1) x 100. Example: 2.50 = +150.
- To American, if decimal is below 2.00: -100 / (decimal – 1). Example: 1.667 = -150 (use the unrounded value, since 1.67 gives -149).
- To fractional: decimal – 1, written as a fraction and simplified. Example: 2.50 gives 1.5 = 3/2.
From fractional odds
- To decimal: (numerator / denominator) + 1. Example: 6/4 = 2.50.
- To American: convert to decimal first, then use the decimal rules above.
Betting odds conversion table
The table covers the prices you will see most often. Decimal values are rounded to three places and probabilities to two, which is why rounding policy matters later in this guide.
| American | Decimal | Fractional | Implied probability |
|---|---|---|---|
| -500 | 1.200 | 1/5 | 83.33% |
| -300 | 1.333 | 1/3 | 75.00% |
| -200 | 1.500 | 1/2 | 66.67% |
| -150 | 1.667 | 2/3 | 60.00% |
| -120 | 1.833 | 5/6 | 54.55% |
| -110 | 1.909 | 10/11 | 52.38% |
| +100 | 2.000 | 1/1 (evens) | 50.00% |
| +120 | 2.200 | 6/5 | 45.45% |
| +150 | 2.500 | 3/2 | 40.00% |
| +200 | 3.000 | 2/1 | 33.33% |
| +300 | 4.000 | 3/1 | 25.00% |
| +500 | 6.000 | 5/1 | 16.67% |
| +1000 | 11.000 | 10/1 | 9.09% |
Implied probability: what the price really says
Implied probability turns a price into a percentage so you can compare it with your own estimate, a model, or another book’s price. Bettors and traders use odds rather than raw probabilities because odds state the payout directly, but probability is the common unit that makes formats comparable.
Two cautions matter for anyone publishing these numbers:
- A single implied probability includes margin. A -110 price implies 52.38%, yet the market may rate each side at a true 50%. Calling 52.38% “the bookmaker’s view” overstates it.
- Implied probability is not a forecast of value. A selection is only good value if its true probability is higher than the implied one. Most content that promises to help readers “spot value” never shows that comparison, so it should not make the promise.
The overround and the vig: how to calculate a bookmaker’s margin
The overround is the amount by which the implied probabilities in a market add up to more than 100%. The vig (or juice) is the commission that overround produces. The formulas:
- Book percentage = sum of (1 / decimal odds) for every outcome
- Overround = book percentage – 100%
- Theoretical margin on stakes (if the book is balanced) = 1 – (1 / book percentage)
Two-way example: -110 on both sides
An NFL spread priced at -110 on each side converts to 1.909 decimal, or 52.38% per side. The book is 104.76%, so the overround is 4.76%.
The margin on money staked is lower. If one bettor stakes $110 on each side, the book takes $220 and pays the winner $210. It keeps $10, which is 4.55% of the $220 handle. On $1 million of perfectly balanced handle at -110/-110, the theoretical margin is about $45,455.
Three-way example: a soccer 1X2 market
Soccer match betting has three outcomes: home win (1), draw (X) and away win (2). Take an illustrative market priced at home 2.10, draw 3.40, away 3.60.
| Outcome | Price | Implied probability | Fair probability (margin removed) | Fair price |
|---|---|---|---|---|
| Home | 2.10 | 47.62% | 45.43% | 2.20 |
| Draw | 3.40 | 29.41% | 28.06% | 3.56 |
| Away | 3.60 | 27.78% | 26.50% | 3.77 |
| Total | 104.81% | 100.00% |
The overround is 4.81% and the theoretical margin on a balanced book is 4.59%. The fair column uses the simplest method: divide each implied probability by the book percentage (104.81%). Traders also use the Shin and power methods, which push more of the margin onto longshots, because books tend to shade underdog prices harder than favourites. The method you choose changes your “fair” odds, so state it when you publish them.
Markets with many outcomes (correct score, first goalscorer, outright winner) usually carry a much larger overround, because the book is spread across dozens of selections and each price is harder for customers to compare. The mathematics of bookmaking reference gives a classic three-way example with a 120% book that returns 16.67% of turnover.
Why the margin is not the hold
The overround is a property of a price. Hold is what a sportsbook actually keeps from handle over a period. The two differ for three reasons:
- Books are rarely balanced. If most money lands on one side and it wins, the book loses on that event even with a 4.76% overround. Hold only converges toward theoretical margin over very large volumes.
- Product mix. Parlays multiply margins leg by leg, and same game parlays add a correlation margin on top. That is why state-reported parlay hold runs far above straight-bet hold. The same game parlay guide walks through New Jersey’s 2026 parlay hold figures.
- Promotions and limits. Odds boosts, free bets and limits on sharp bettors move gross hold and net revenue in different directions.
The operator-side maths of how structural margin, results and promotions combine is covered in is sports betting profitable.
Parlays: multiplying the odds
A parlay (accumulator in the UK) pays the product of its legs’ decimal odds. A three-leg parlay at -110, -115 and +240 is 1.909 x 1.870 x 3.40 = 12.14 in decimal, or about +1114 in American odds. A $100 stake returns about $1,214.
Margins compound the same way. Two legs each from a 109.09% book (5/6 on both sides of a tennis match) produce a combined book of 119.01%, a 19.01% overround. That compounding is the core of parlay economics. Our parlay guide shows payouts and house edge by leg count.
Asian odds formats: Hong Kong, Malay and Indonesian
If your feed supplier serves Asian markets, or you build content for those audiences, you will meet three more formats. All three are derived from decimal odds.
- Hong Kong odds = decimal – 1. The number is the net profit per 1 unit staked. Decimal 2.50 is HK 1.50.
- Malay odds: if Hong Kong odds are 1.00 or less, Malay = Hong Kong odds (positive). If Hong Kong odds are above 1.00, Malay = -1 / Hong Kong odds (negative). A positive Malay price is the profit per 1 staked; a negative one is the stake needed to win 1.
- Indonesian odds are American odds divided by 100. If Hong Kong odds are 1.00 or more, Indonesian = Hong Kong odds (positive). If below 1.00, Indonesian = -1 / Hong Kong odds (negative).
| Decimal | American | Hong Kong | Malay | Indonesian |
|---|---|---|---|---|
| 1.500 | -200 | 0.50 | 0.50 | -2.00 |
| 1.909 | -110 | 0.91 | 0.91 | -1.10 |
| 2.000 | +100 | 1.00 | 1.00 (or -1.00) | 1.00 (or -1.00) |
| 2.500 | +150 | 1.50 | -0.67 | 1.50 |
| 4.000 | +300 | 3.00 | -0.33 | 3.00 |
Watch the sign conventions: in Malay odds the minus sign marks the underdog, the opposite of American and Indonesian odds. Mixing the two up is a common error in vendor documentation, including one widely read supplier explainer reviewed for this guide.
Odds movement: what a line change signals
Prices move between the opening line and the start of an event. For anyone reading or publishing odds, movement carries information.
How sportsbooks set lines
Line origination starts with a model of the true probability, built from team and player data, injuries, weather and market prices elsewhere. Traders then add margin and set limits. Many books do not originate most prices themselves. They take odds feeds or managed trading from suppliers such as Sportradar, Genius Sports, Kambi and OpenBet, then adjust a subset of markets in house. A small number of low-margin, high-limit books are widely watched as market makers, and many retail books move their prices in line with them.
What steam and reverse moves mean
- Steam is a fast, market-wide move, usually triggered by sharp money or news hitting several books at once.
- Reverse line movement is when the line moves against the side taking most bets. Published “betting percentages” (share of tickets against share of money) are often used to spot it: if 70% of tickets back a team but the price drifts away from it, larger stakes are likely on the other side.
- News moves follow injuries, line-ups and weather, and are the most common reason a price shortens or drifts.
Stale prices after a move are where arbitrage opportunities appear, which is why books monitor and limit arbers. The arbitrage betting guide covers the operator response.
How operators display odds by market
The format a customer sees is a display layer. Internally, most trading platforms and odds APIs store decimal prices and convert at the front end. The common defaults:
| Market | Default display | Notes |
|---|---|---|
| United States | American | Some apps also offer decimal as an option |
| Continental Europe, Canada, Australia | Decimal | Comma separator in some European locales |
| UK and Ireland | Fractional | Strongest in horse racing; decimal is widely offered as an option |
| Asian markets | Hong Kong, Malay or Indonesian | Often shown alongside decimal; Asian handicap lines dominate soccer |
Two implementation details cost operators money if they are ignored:
- Rounding rules. American odds are usually shown in steps of 5 (-110, -115), decimals to two places, and fractions on a fixed ladder of traditional prices (for example 4/5, 5/6, 10/11, evens). When a model price falls between two ladder steps, the choice of step changes the margin. Rounding toward the shorter price adds margin, rounding toward the longer price gives it away. Make sure the price you settle at is the price you displayed.
- Conversion drift. Converting a rounded decimal to American and back can move a price by a point (1.67 converts to -149, not -150). Convert from the stored master price, never from a displayed one.
If you are choosing a data source for prices, the odds API comparison covers coverage, latency and pricing by provider.
Regulatory rules on odds display
No rule we reviewed for this guide forces a sportsbook to use one odds format. The regulation that does exist is about transparency and fair presentation.
- Great Britain, virtual events. The Gambling Commission’s remote technical standard RTS 3 requires chance-of-winning information to be available before the customer gambles, and its guidance names “the house edge, margin or over-round” as acceptable disclosure for virtual races. It also says odds on virtual events should reflect the probability of each outcome as closely as possible. This applies to virtual event betting, not to live sports markets.
- Rules and settlement. Licensed books publish house rules that cover voids, obvious-error (palpable error) prices and settlement. The exact requirements differ by licence, so check the specific standard in each jurisdiction you hold a licence in.
- Ontario and Australia. We could not confirm any Ontario or Australian rule that mandates a display format or implied-probability disclosure for sports betting. Check the AGCO Registrar’s Standards for Internet Gaming and the relevant Australian state or territory regulator before assuming none applies.
Rules change often. The monthly regulation roundup tracks new standards as they land.
Odds and prediction markets
Prediction markets quote prices instead of odds, but the maths is the same. A contract that pays $1 if an event happens and trades at 65 cents implies a 65% probability, before fees and spread. Converted, that is decimal 1.538 or about -186 in American odds.
The difference is how the venue earns. A sportsbook builds margin into every price. An exchange-style prediction market charges a trading fee and lets the bid-ask spread form between users. For a full comparison, see the prediction markets explainer. If you publish odds-comparison content, decide whether you show prediction market prices before or after fees, and say which.
What it means for operators
- Localise the format, not just the language. Default to the market’s dominant format and offer a switch. Store one master decimal price per selection.
- Set margin by market, not by book. High-volume, efficient markets (NFL sides, Premier League 1X2) carry thin margins because customers compare prices. Props, specials and same game parlays carry higher margins because comparison is harder. Lower margins attract volume and sharper customers; higher margins raise hold per dollar but cost turnover.
- Publish the rounding policy internally. Product, trading and content teams should all convert the same way.
- Disclose where required. For virtual events in Great Britain, have margin or probability information ready before launch.
What it means for affiliates and SEO teams
- Odds comparison content is evidence content. If a page says a book has “the best odds”, that is an objective claim. In the UK, the CAP Code’s rule 3.7 requires documentary evidence before publishing claims that can be objectively substantiated, and rules 3.33 to 3.35 require comparisons to be objective, verifiable and like for like. Keep timestamped price snapshots behind any “best odds” or “highest payout” line.
- Show the margin, not just the price. Ranking books by overround on the same market is more defensible and more useful to an industry reader than picking a single price.
- Get the maths right. The top-ranking explainers reviewed for this guide include a negative-odds probability formula missing its absolute value, a positive American conversion that returns 3.50 instead of 2.50 for +150, and a decimal-to-fraction step that produces 11/8 instead of 11/4. Search engines and AI answers increasingly quote formulas directly, so accuracy is a ranking asset.
- Keep it informational. Explaining how odds work is different from telling readers what to bet. Leave picks out of glossary content and follow each market’s advertising and responsible gambling rules where you do promote operators.
Next step
Odds are where product, trading, compliance and content meet. Agree one master price format and one rounding policy across your teams, then check every published conversion against the formulas above. For the vocabulary around prices, see our sports betting terms glossary.
This guide explains how odds are calculated and displayed for industry readers. It is not betting advice. If gambling stops being fun, contact a support service in your country.